📊 View Reports
Last updated About 2 months ago
Gain deeper insights into your spending with charts, summaries, and period-based analysis.
What can you do here?
Analyze expenses by period
Review your spending across different time ranges and compare how your financial habits evolve over time.
Week: Compare the current week with the previous one.
Month: Review expenses from the current month or the previous month.
Year: Get a broader view of your finances by comparing the current year with the previous year.
Filter your results
View all expenses combined or focus on a specific category to better understand where your money is going.Compare spending over time
See expense totals for the selected period and compare them with previous periods.Visualize spending patterns
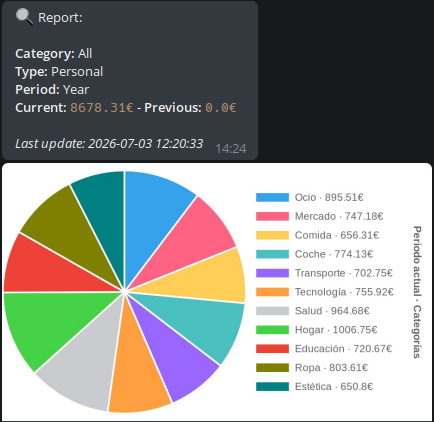
Qullqi generates charts that make trends and spending behaviors easier to understand at a glance.
Available visualizations
📊 Bar charts for period and category comparisons
🥧 Pie charts for spending distribution
💰 Expense totals and aggregated summaries
📈 Historical comparisons between periods
📅 Annual balance charts to identify spending peaks and trends throughout the year
💡 Reports are designed to help you understand your financial habits, identify trends, and make smarter budgeting decisions.